ISEC Community Workshop:
Benchmark Problems
Discussion group about Benchmarks Challenge
Submitting your benchmark solution
Benchmark #1
Benchmark #2
Two benchmark problems have been prepared for this workshop. The first is a simple beach-only setup for which physical data are provided as part of the benchmark information. The second includes an island feature, and is being conducted as a "blind benchmark" (physical data to be collected separately, prior to the workshop).
Benchmark #1
This experiment has a single solitary wave propagating up a triangular shaped shelf. Free surface information was recorded via resistance-type wave gauges and sonic wave gages. Velocity information was recorded via ADV's. For a brief review of the experiments, see the short presentation. A complete description of the experiments and data is also provided. A zipfile is available of the various data provided for the benchmark exercise. The filenames correspond to the Figure numbers in this webpage.For this benchmark, we will compare free surface, velocity, and turbulence information recorded throughout the basin.
Setup
Water depth at Wavemaker: 0.78m
Solitary wave height at wavemaker: 0.39m
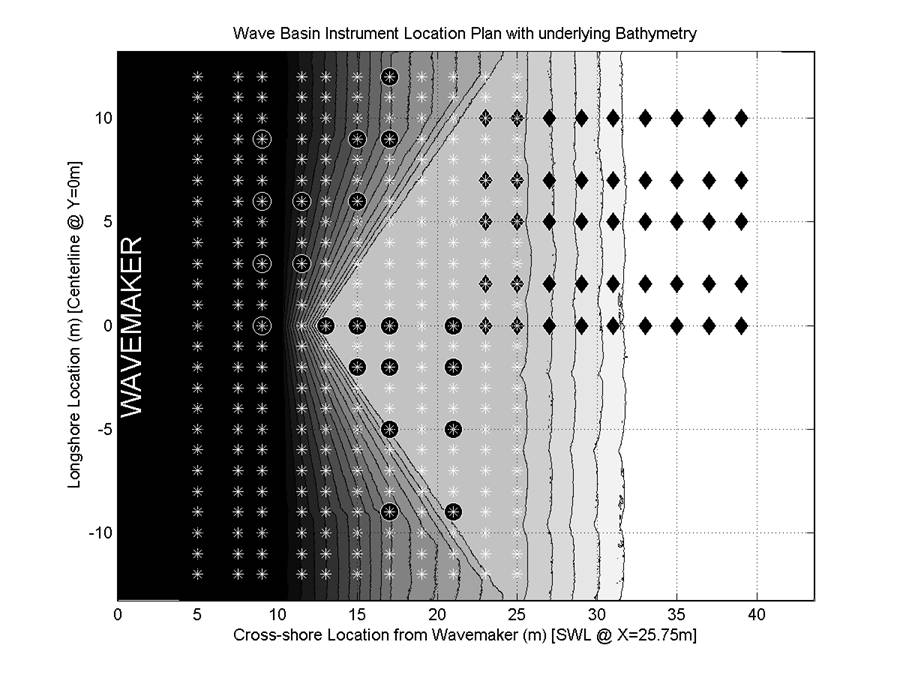
Bathymetry: Can be found in the figure below. Scatterset data in
TWB 071708_5CM_XYZ_METERS.txt, all in meters. The Figure below
(which includes the bathymetry data) can be plotted in Matlab with the
plot_bathy.m script.
|
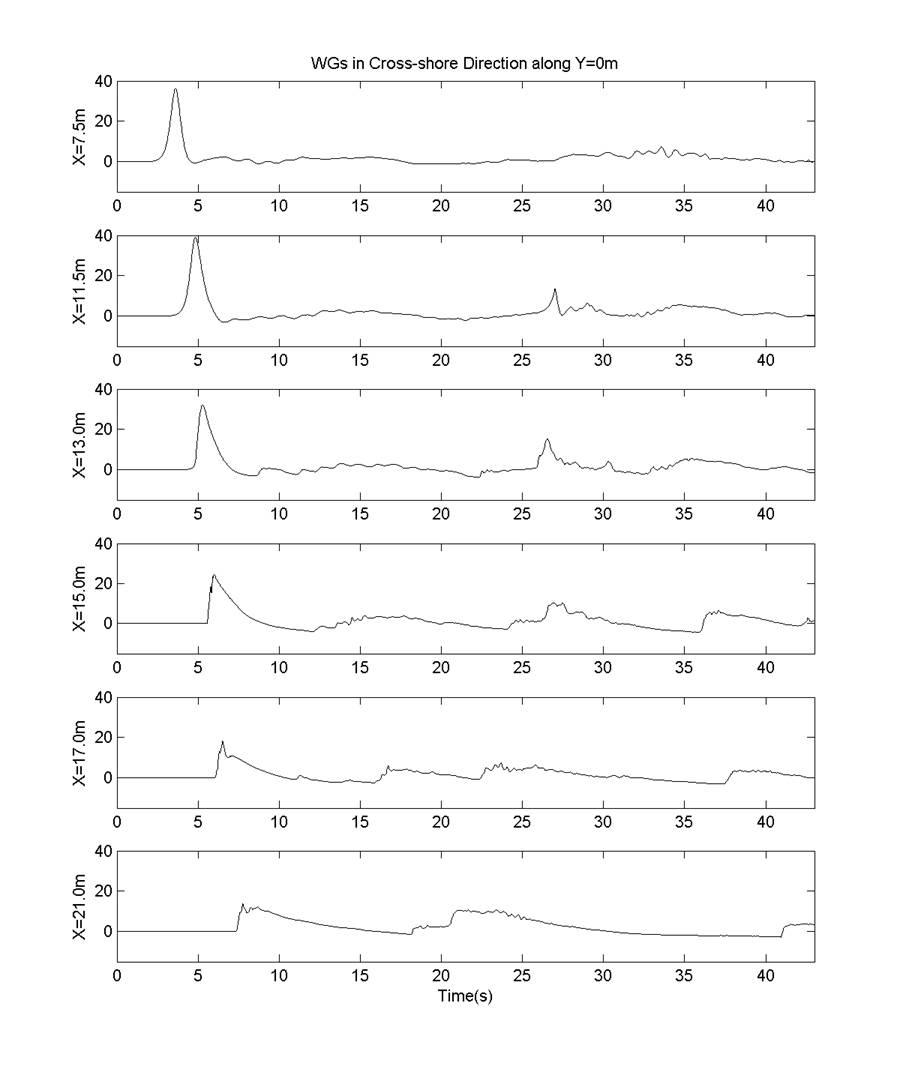
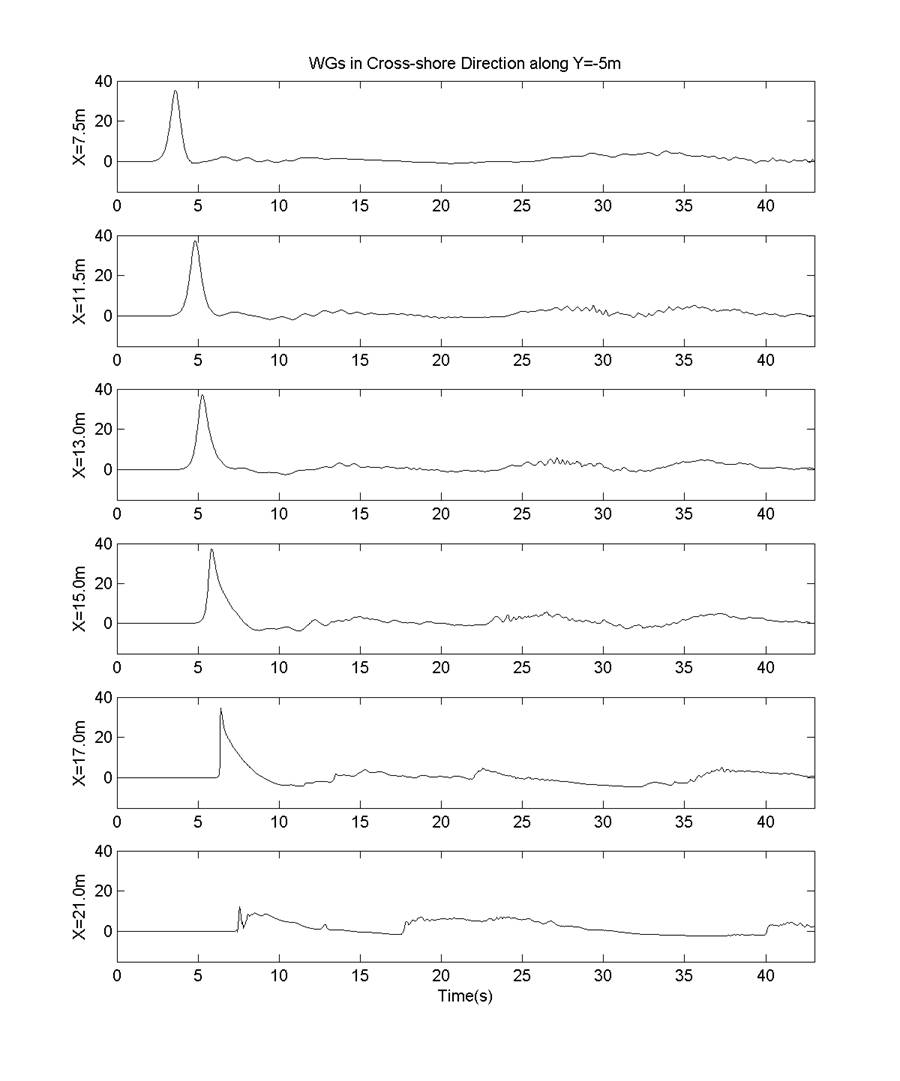
Free Surface Elevation Measurements
Recorded at y=0 (centerline of basis) at various x locations on the shelf.
Figure below can be created in Matlab, with the WG_along_Y_0.m script
(vertical axis units in cm)
|
|
|
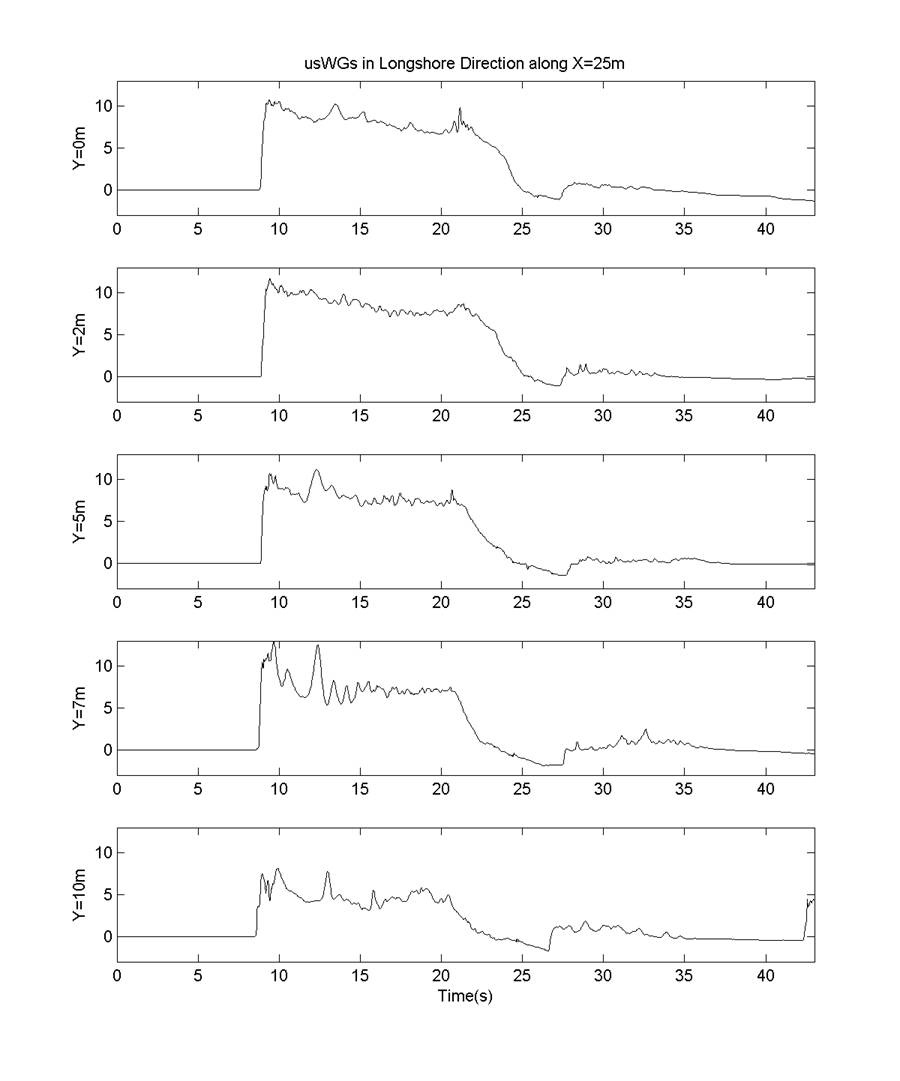
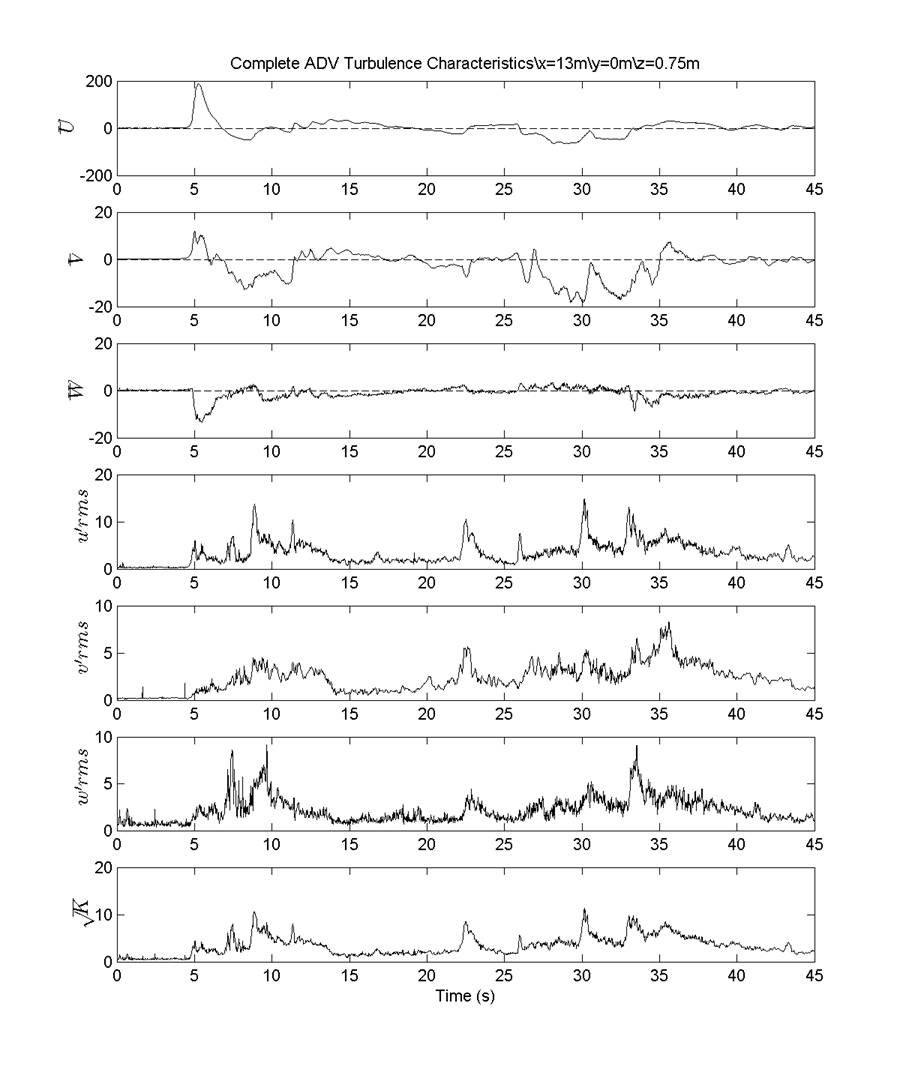
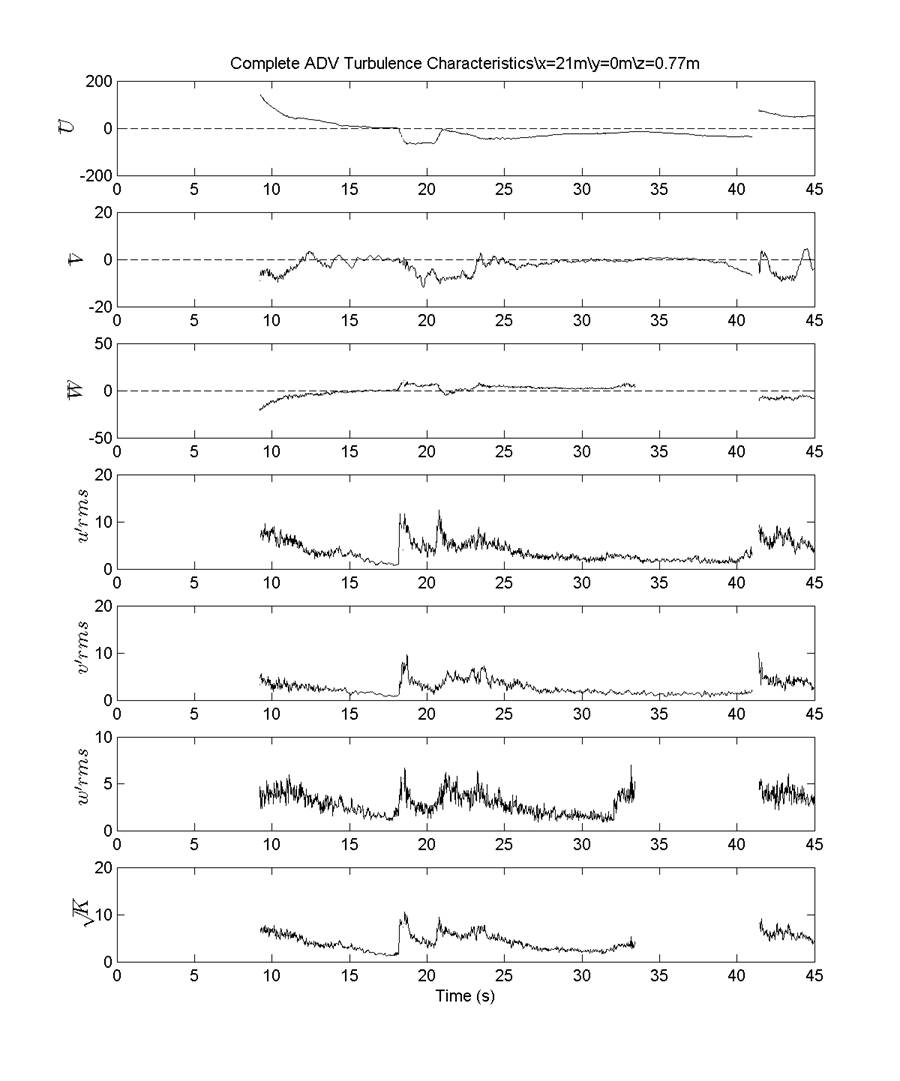
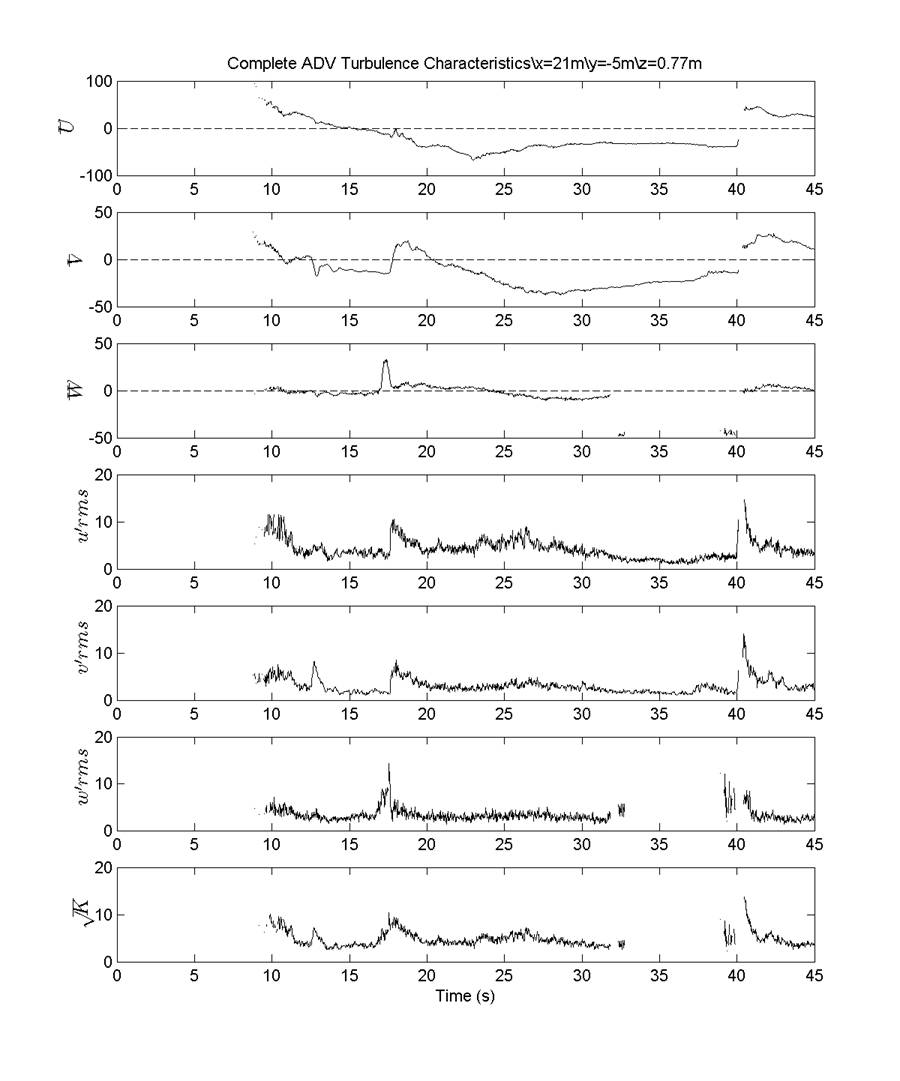
Velocity and Turbulence Measurements
Recorded at x=13m, y=0m, z=0.75 m (3 cm from still water level)
Figure below can be created in Matlab, with the ADV_x13m_y0m_z075cm.m
script (vertical axis units in cm/s)
|
|
|