Workshop on Tsunami Hydrodynamics in a Large River
Instructions and Some Suggestions to Modelers
The model tsunami used for our simulation is synthesized based on a DOGAMI Cascadia source LLX (98%); hence it is hypothetical.
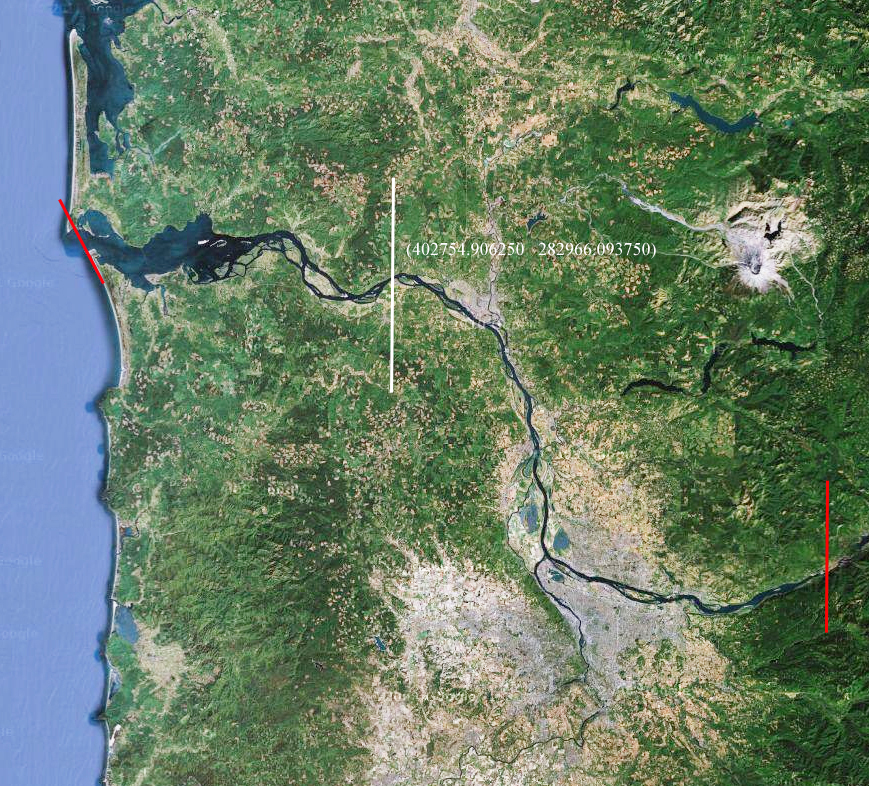
Figure 1. Domain of the river simulatIon is identified between two red lines. The white line is the boundary to split the problem into two, that is located at (402754.906250 282966.093750) or 123°10'45.6"W 46°10'55.6"N).
Bathymetry and topography data: Note that the data grid is 2 x 2 m: extremely fine so that you may want to create your own grids for your simulations. The data consist of six files, and some ranges of data are overlapped in the adjacent data files. Download data
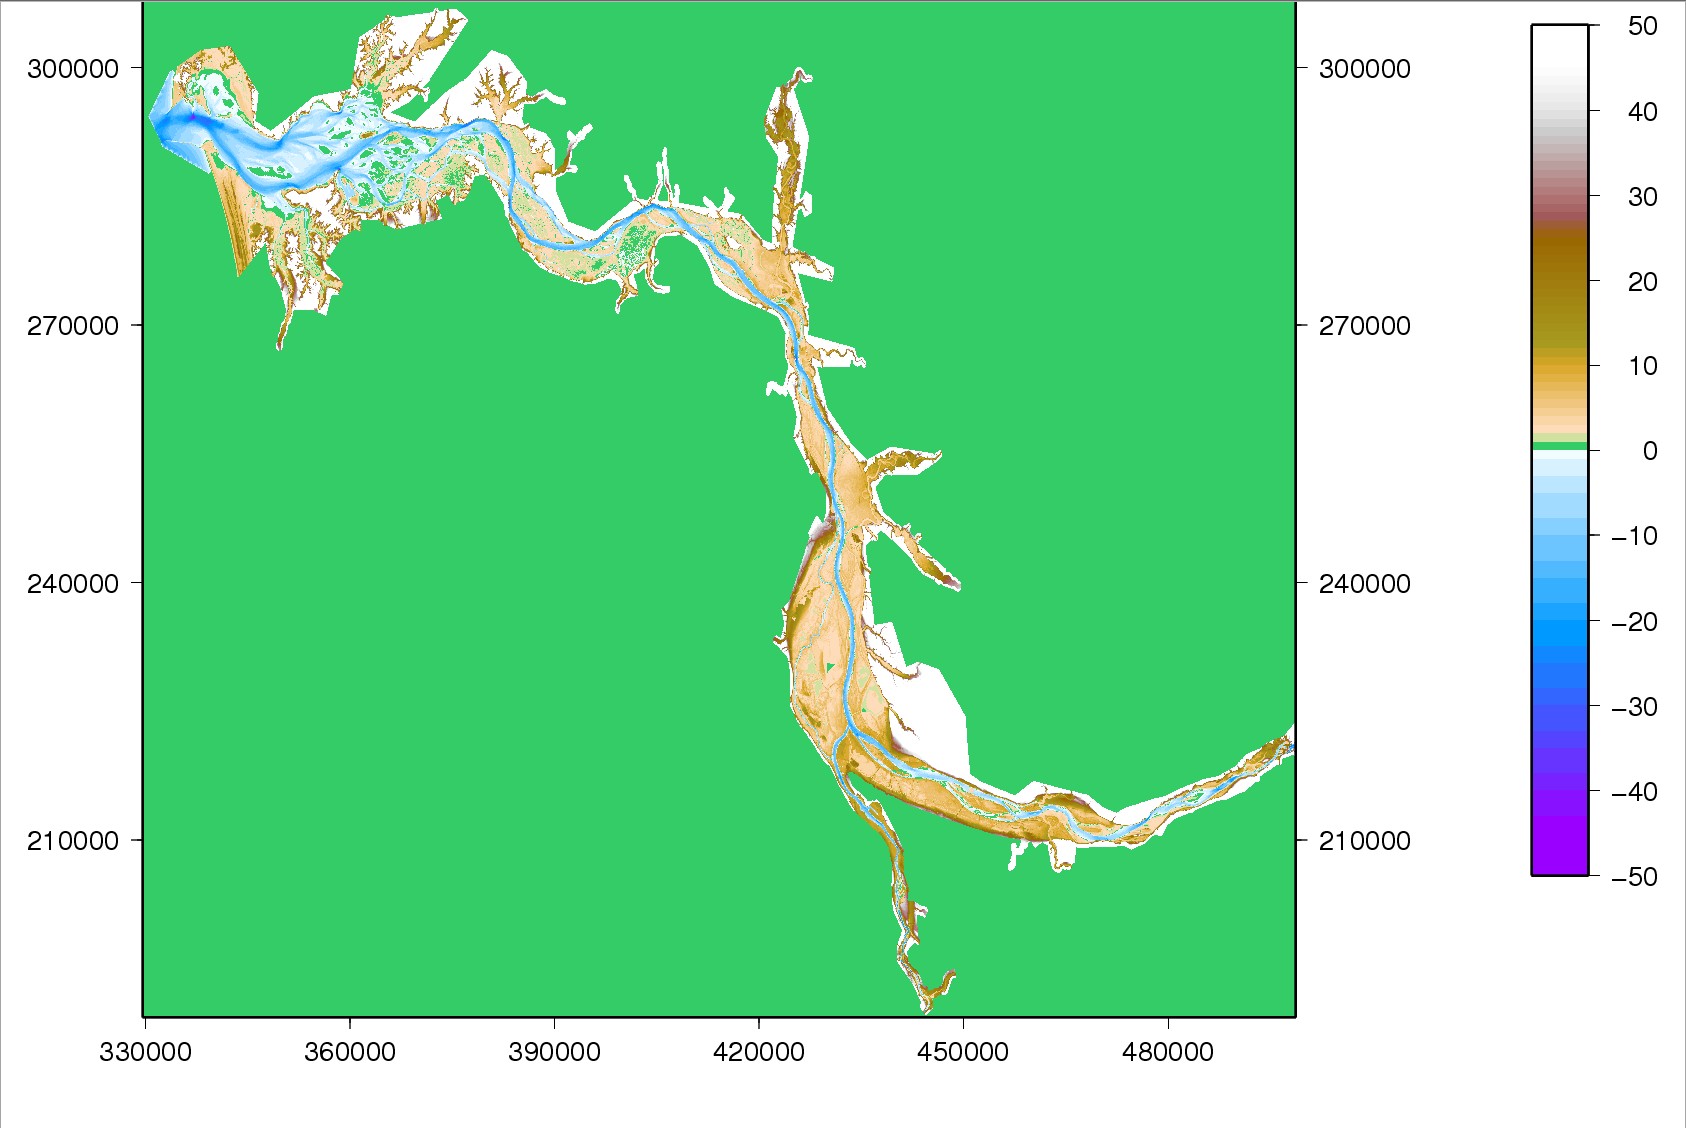
Figure 2. Integrated bathymetry and topography data. The original data have very fine grid size (2 x 2m).
Initial Condition (t < 0, and prior to tsunami) for the river flow should be computed based on the following conditions:
- The river discharge rate from the upstream boundary (Bonneville Dam) is 7,000 m3/sec, and this remains constant throughout the domain.
- The flow from the Willamette River is neglected.
- The water surface elevation at the river mouth is constant at z = 0m.
- Baseline Darcy's friction factor f is 0.025 for the upper reach (east of the white line shown in the figure) and 0.018 for the lower reach (west of the white line). Note that the while-line boundary is located at (402754.906250 282966.093750) or 123°10'45.6"W 46°10'55.6"N)
- We should also simulate the case with no river flow, i.e. the quiescent state for the river, for the comparison.
Boundary Conditions:
- The upstream boundary condition at Bonneville dam is a vertical wall with the constant discharge rate of 7,000 m3/sec.
- The downstream boundary conditions at the river mouth for 8 hours are given in the same website (also shown in below): the water-surface and velocity time histories at the middle point of the river mouth. You may assume the flow conditions along the boundary based on this information. The river mouth boundary should be identified along the transect line of (X, Y) = (336717, 292789) and (333110, 294623).
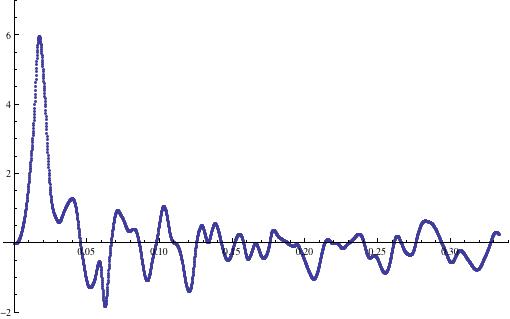
Figure 3. Water-surface variation at the river mouth
Common Baseline Outputs – let us compare our results at several locations by plotting the simulated time series of water-surface elevations and velocities at the following locations.
- Location 1 – at Skamokawa, the end of the river ‘estuary’ (X, Y) = (381251, 292633).
- Location 2 – Our intermediate boundary shown in the white line located at (X, Y) = (402755, 282966).
- Location 3 – at the confluence of the Cowlitz River and the Columbia in Longview, WA at (X, Y) = (422211, 272317)
- Location 4 – at the confluence of the Willanette River and the Columbia in Portland, OR at (X, Y) = (433360, 224029)
- Location 5 – at the Bonneville Dam (X, Y) = (497110, 221314)
(If you wish, you may also try to see what would happen at the following two locations: Location 1a – East of Astoria (X, Y) = 357293, 288286); Location 1b – (X, Y) = (366622, 292810): these are options)
Some Additional Simulations You May Wish to Consider:
- Friction effects are not easy to evaluate, especially the effects strongly
depend on the water elevations: e.g. flooded vegetation. Some sensitivity study
should be made. For example:
- what if friction were neglected?
- what if Darcy’s friction factor f were 0.0275 for the upper reach (east of the white line shown in the figure) and 0.020 for the lower reach
- You may also consider running additional cases with reduced or increased
tsunami amplitudes.
- Tidal effects: for simplicity, let us assume the tide range is +/-1.5 m at
the river mouth (along the transect line of (X, Y) = (336717, 292789) and (333110,
294623)), and the period 12.42 hours. We recognize that the simulation of tidal
effects is not trivial, and the model spin-up would take a long time even with a
constant discharge rate and a monochromatic tidal fluctuation. Therefore, for
simplicity, we assume the initial flow condition to be still steady but changing the
initial condition with the different discharge rate and the water level at the river
mouth. For example,
- To mimic the ebb tide, use the initial condition with Q = 14,000 m3/sec
and the initial tide level = – 1.5 m at the river mouth.
- To mimic the flood tide, use the initial condition with Q = 0 and the initial tide level = 1.5 m at the river mouth.
- To mimic the ebb tide, use the initial condition with Q = 14,000 m3/sec
and the initial tide level = – 1.5 m at the river mouth.
For those of you who are having difficulties to identify the bathymetry data, the following are some example locations (X, Y) ⇔ (i, j) base on 4-m grid:
(0, 0) is set at the upper left corner of the dataset, and i and j represents the row and column numbers.
| (497110, 221314) ⇔ (41880, 21729) | (433360, 224029) ⇔ (25942, 21050) |
| (422211, 272317) ⇔ (23155, 8979) | (381251, 292633) ⇔ (12915, 3900) |
| (336717, 292789) ⇔ (1782, 3861) | (333110, 294623) ⇔ (880, 3400) |